
Last year California Competes introduced the Postsecondary to Prosperity Dashboard, an interactive website, report, and suite of fact sheets focused on understanding opportunity across the state and by racial and ethnic groups and the state’s 12 regions. The Dashboard developed indicators from eight primary datasets: seven individual-level datasets and one business-level dataset. One of our takeaways from this project is how seemingly small differences in the collection and reporting of racial and ethnic identification can significantly affect the ability of researchers and policy analysts to make valid and actionable findings about education and employment within and across datasets.1 In this blog, we detail for other researchers a few ways in which these differences play out and how we resolved them in the Dashboard.
Differences in race and ethnicity categories across datasets necessitate careful attention to make findings as useful as possible. Different datasets have varying categories of race and ethnicity, which complicates the process of tracking and comparing the progress of groups across the domains of education, employment, and prosperity. For example, the California Department of Education (CDE) reports statistics for Filipino students separately from other Asian students while most other data sets do not separate data on Filipino students from other Asian students. Researchers typically aggregate up to make comparable categories, which leads to the loss of valuable information on equity. In our Dashboard, we took another approach to preserve the data on Filipino students. When available, we present outcomes for high school students, namely counts of graduates, for those who completed the courses required for admission to public universities, and the college destinations of recent graduates separately for Filipino Californians and other Asian Californians. Doing so allows analysts and policymakers who prefer statistics that combine both groups to simply add two numbers together.
Overly broad race and ethnicity categories conceal large and meaningful differences within groups that become apparent with more detailed groupings. Most datasets use fewer than ten categories of race and ethnicity, which can obscure meaningful differences within groups. A standout exception to this rule is the American Community Survey (ACS), which records hundreds of categories (many of which are Native American and Alaska Native tribes) based on both offered response options and volunteered (fill-in-the-blank) answers.2,3 In our Dashboard, we collapsed this list into 14 detailed categories: White, Black, Native American or Alaska Native, Pacific Islander, East Asian, Southeast Asian, South Asian, other Asian, Mexican, Puerto Rican, Cuban, Central American, South American, and other Latinx. This level of detail is possible because the ACS is specifically designed for research on small groups (among other purposes), whereas the other six individual-level datasets are based primarily on administrative data collected for other purposes.4 Each year the ACS samples households representing over 300,000 Californians,5 which is critical for reliably measuring numerically small populations, especially in sparsely populated areas. Surveys of this quality, magnitude, and complexity are pricey—the ACS costs over $200 million per year to conduct—but they demonstrate what is lacking in datasets without fine-grained categories of race and ethnicity.6
For sake of illustration, consider Asian Californians, a group with a diverse set of immigration patterns and experiences. The Dashboard shows that 61 percent of Asian Californians statewide have earned a bachelor’s degree, but that number conceals a wide range of outcomes for specific Asian groups (reproduced in figure 1, below). At one end of the spectrum, 46 percent of Southeast Asians completed a bachelor’s degree, and at the other end of the spectrum, 79 percent of South Asians did so—a difference of 32 percentage points! There is a similar spectrum of bachelor’s degree attainment for specific groups of Latinx Californians, with values ranging from 13 percent of Mexican Californians to 45 percent of South American Californians.
Figure 1. Bachelor’s degree attainment of Asian Californians, overall and by detailed group: 2017
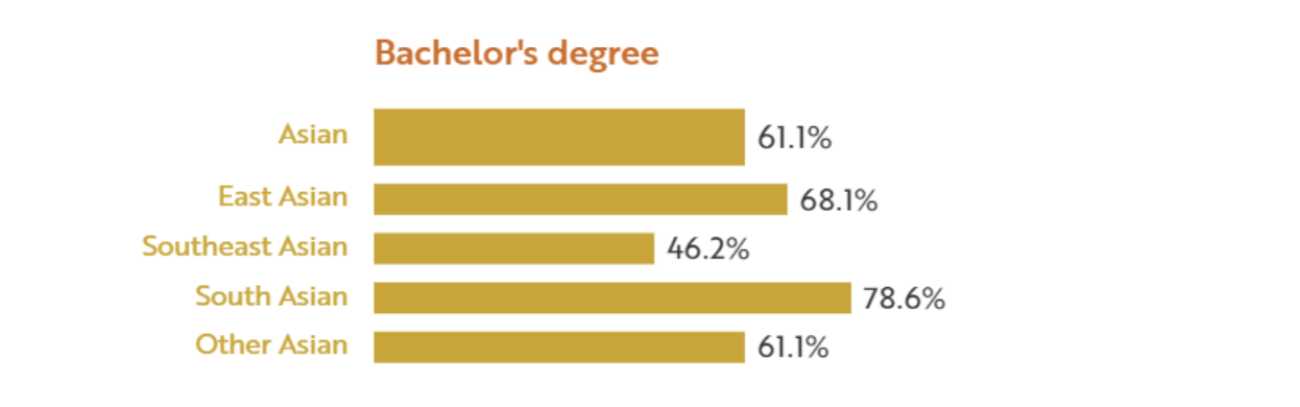
Source: California Competes. (2020). Postsecondary to Prosperity Dashboard. https://p2p.californiacompetes.org//regions?region=statewide
Racial and ethnic groups can be created for historical, bureaucratic, or political reasons that can hide meaningful results. A third challenge we encountered was an inability to include statistics for particular groups because the data were categorized in common, often politically-driven, classifications maintained by bureaucratic inertia. These misclassifications can distort important distinctions and, as a result, produce inaccurate and misleading analytical results. Sometimes this limitation is unavoidable, such as categories that are not specified in the first place. For example, few state and federal datasets have a category for Americans of Middle Eastern, North African, and Southwest Asian descent, even though they number about 3 million in total and nearly 400,000 in Los Angeles County alone.7 Despite long-standing objections from members of this community, they are typically classified as White.8 Researchers must pay close attention to not just the technical, but the political construction of race and ethnicity categories their analyses of equity and opportunity.
Univariate disaggregations can miss important interactions between key characteristics, like race and gender—often referred to as intersectionality. Datasets like those from the CDE used by the Dashboard to describe high school students’ opportunities, attainment, and college destinations, report statistics by race or ethnicity or gender, but datasets that report both at once can reveal more nuanced and even unexpected results. Case in point, while the median income for California men is $3,000 higher than the median income for California women, this gender gap varies dramatically when looking at interactions with race (figure 2).
Figure 2. Gender wage gap for Californians, overall and by selected racial and ethnic groups: 2017
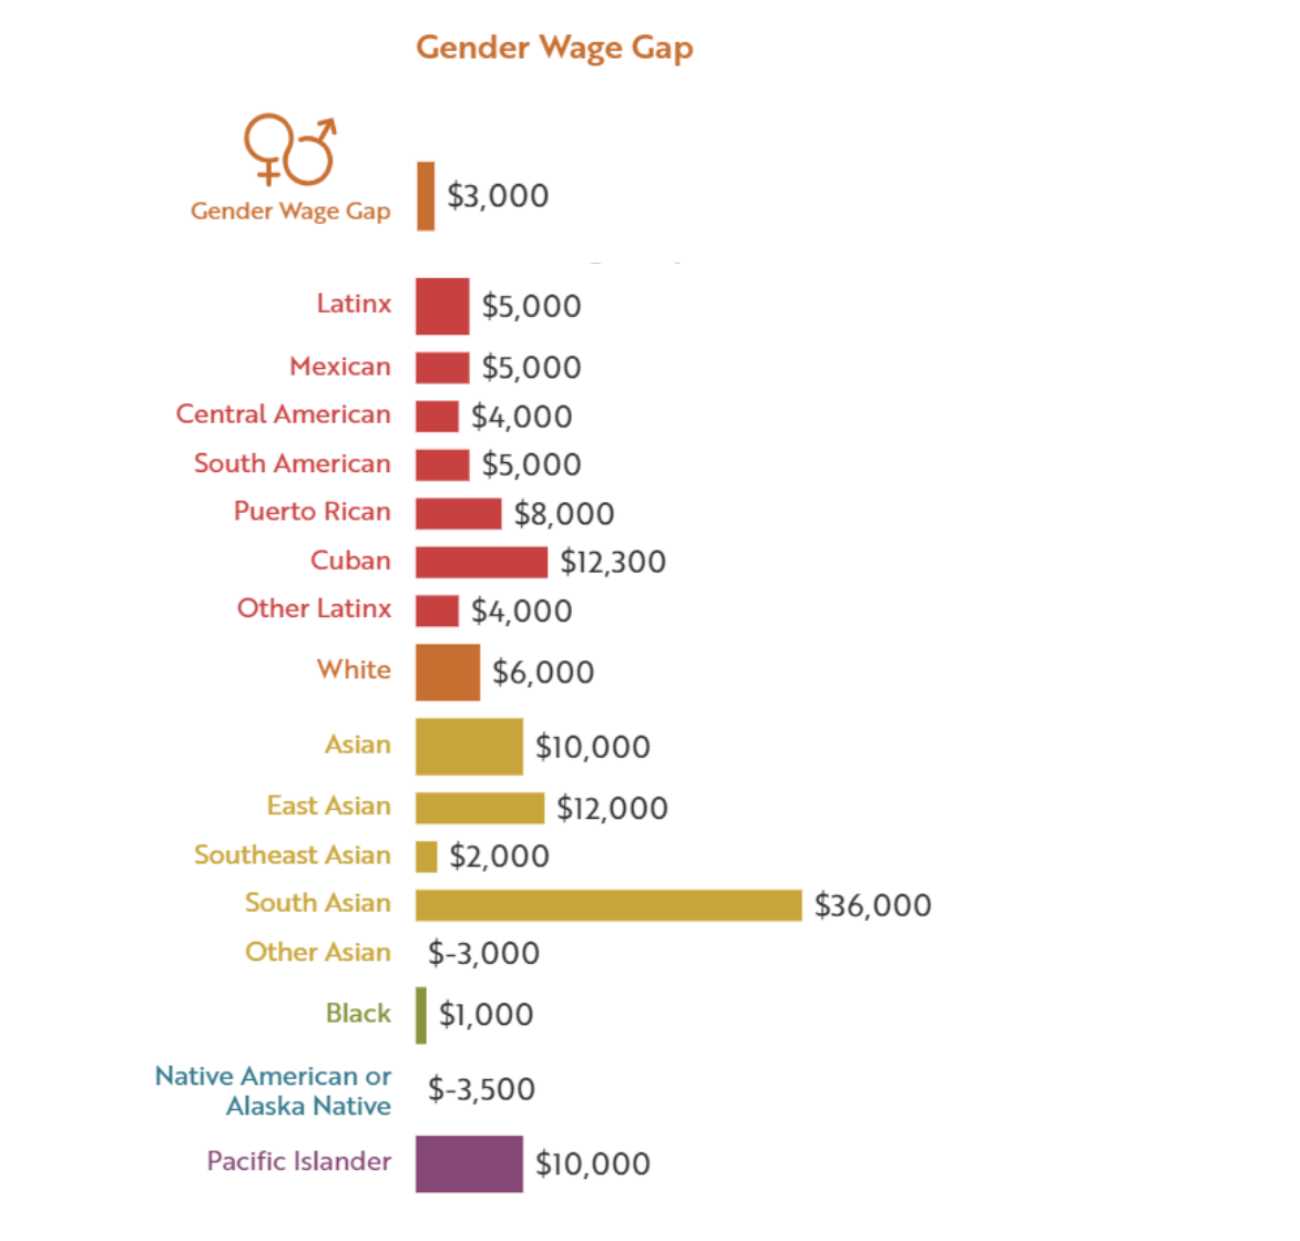
Note: The gender wage gap equals the median earnings of men minus the median earnings of women among all men and women working 30 to 40 hours per week and not enrolled in school. As of 2017, the American Community Survey did not collect data on other genders.
Source: California Competes. (2020). Postsecondary to prosperity dashboard. https://p2p.californiacompetes.org//regions?region=statewide
The future holds promise for better race and ethnicity data and, until then, researchers must be painstakingly careful and deliberate in providing policymakers relevant and actionable information. California’s forthcoming Cradle-to-Career Data System presents a fresh chance to fill in some of the gaps in our understanding of how race and ethnicity affect the experiences of Californians in education, the workforce, and beyond. A successful implementation would allow researchers to conduct analyses disaggregated by consistent, detailed, and comprehensive categories of race and ethnicity (and interactions) without compromising the privacy of the research subjects. To be sure, the Data System cannot add detailed data that its tributary data sources do not collect, but there is momentum on that front as well. For instance, in 2013 the University of California added a category for individuals of Middle Eastern ancestry to its undergraduate application form, and students at the California State University have asked for the same treatment.9,10 Efforts like these will help enhance our understanding of racial equity in California. Until datasets with more detailed race and ethnicity categories are widely available, we raise these issues to help researchers navigate data limitations to improve our understanding of uneven opportunities by race and ethnicity.
1 A thorough explanation of the terms race and ethnicity is beyond the scope of this blog, but in brief, race consists of socially-determined categories of identification such as White, Black, and Asian, whereas the Latinx (or Latino or Hispanic) ethnicity indicates family origins in Spanish-speaking Latin American countries or in Spain, irrespective of race.
2 US Census Bureau. (n.d.). American Community Survey (ACS). https://www.census.gov/acs
3 US Census Bureau. (n.d.). American Community Survey: Why we ask questions about race. https://www.census.gov/acs/www/about/why-we-ask-each-question/race
4 Groves, R. M. (2011). Three eras of survey research. Public Opinion Quarterly, 75(5), 861-871. https://academic.oup.com/poq/article/75/5/861/1831518
5 US Census Bureau. (n.d.). American Community Survey: Sample size. https://www.census.gov/acs/www/methodology/sample-size-and-data-quality/sample-size
6 Williams, J. D. (2021, January 25). Overview of FY2021 appropriations for the Census Bureau (version 3). Congressional Research Service. https://crsreports.congress.gov/product/pdf/IF/IF11538/3
7 Parvini, S., & Simani, E. (2019, March 28). Are Arabs and Iranians white? Census says yes, but many disagree. Los Angeles Times. https://www.latimes.com/projects/la-me-census-middle-east-north-africa-race
8 Our Dashboard follows this convention to allow comparability with other data sources.
9 Yoder, C. (2013, May 28). UC to include Southwest Asian, North African category on next year’s undergraduate application. Daily Californian. https://www.dailycal.org/2013/05/27/uc-to-introduce-new-category-for-southwest-asian-and-north-african-students-in-2013-2014-undergraduate-application
10 Benda, J. (2021, January 24). Students urge CSU to include SWANA identity on application. Daily Titan. https://dailytitan.com/news/campus/students-urge-csu-to-include-swana-identity-on-application/article_a0a283f0-5eb1-11eb-ab77-1b1d842f796e.html