
Degrees of Value:
Exploring How College ROI in California Differs by Race,
Ethnicity, and Sex

- Introduction
- A Bachelor’s Degree Pays Off for Most Graduates of Public Colleges
- Associate’s Degrees from Community Colleges Also Pay Off, Though Less Consistently than Bachelor’s Degrees
- Uneven Opportunity in Education and the Workplace Help Explain Variation in ROI
- Recommendations for Advancing ROI for All Graduates
- College: A Good Investment That Can Be Made Even Better
- Acknowledgments
- Appendix
- Notes
- Related Resources
College remains one of the most reliable paths to upward mobility, but its economic return isn’t shared equally.
This research brief from California Competes, in partnership with the College Futures Foundation and Strada Education Foundation, finds that the return on investment (ROI) in higher education differs along lines of race, ethnicity, and sex, highlighting where targeted action is needed to make higher education a true engine of opportunity for all Californians.
This is the first analysis in the Degrees of Value research series, which examines how the economic payoff of college varies across demographic groups and regions using a dataset of more than 30,000 recent California graduates. The analysis measures whether students recover the cost of their education within ten years of completion, offering insights into who benefits most, who is left behind, and how state and institutional leaders can close these gaps.
Watch the webinar recording to learn more.
“These results confirm that college delivers value, but they also reveal unfinished work. Higher education continues to open doors, but too many Californians face systemic barriers that prevent their degrees from translating into the economic security they’ve worked so hard to achieve.”
—California Competes CEO Su Jin Jez
- Most Californians obtain an earnings boost from a college degree that will exceed their total educational costs within 10 years, especially if they earn a bachelor’s degree.
- Bachelor’s degrees from public universities pay off 78 percent of the time, yet the rate varies by race, ethnicity, and sex (73%–83%), with Asian and white Californians more likely than their Black and Latinx peers to achieve a positive return.
- Associate’s degrees from community colleges pay off 62 percent of the time, lower than the rate for bachelor’s degrees, and the pattern of differences by race, ethnicity, and sex is more complex and wide-ranging (54%–76%).
- Even with most graduates seeing a positive return on their degrees, these percentages leave plenty of room for improvement. Colleges and policymakers can improve graduates’ return on investment by:
- Improving college affordability
- Engaging employers to promote career-building opportunities and skills
- Actively using workforce data and employer feedback to guide students, program offerings, and policies
- Employing evidence-based programs to boost timely degree completion and transfer
- Continuing thoughtful development of the state’s Cradle-to-Career Data System (C2C)
The ability to obtain a better job is a top motivator for college students and, on average, a college degree leads to a valuable return on investment (ROI) with an earnings boost exceeding the cost of their education.2 However, these dividends are not equally distributed among California college graduates. This brief uses a sample of over 30,000 recent college graduates aged 25–29 whose highest education is a bachelor’s degree or associate’s degree to examine variation in ROI by race, ethnicity, and sex.3 Understanding which Californians do and do not achieve a positive ROI is the first step toward designing equity-centered policies that reduce costs, increase earnings, and make college a worthwhile investment across the board.
This analysis is part of California Competes’s Degrees of Value research, done in partnership with the College Futures Foundation and Strada Education Foundation, to examine how the economic return on college varies by race, ethnicity, sex, and region. The research seeks to help policymakers and institutions understand where and for whom college pays off and where targeted reforms are needed to close equity gaps. This series uses an approach and measures developed by the Strada Education Foundation for its State Opportunity Index.1
What Do We Mean by ROI?
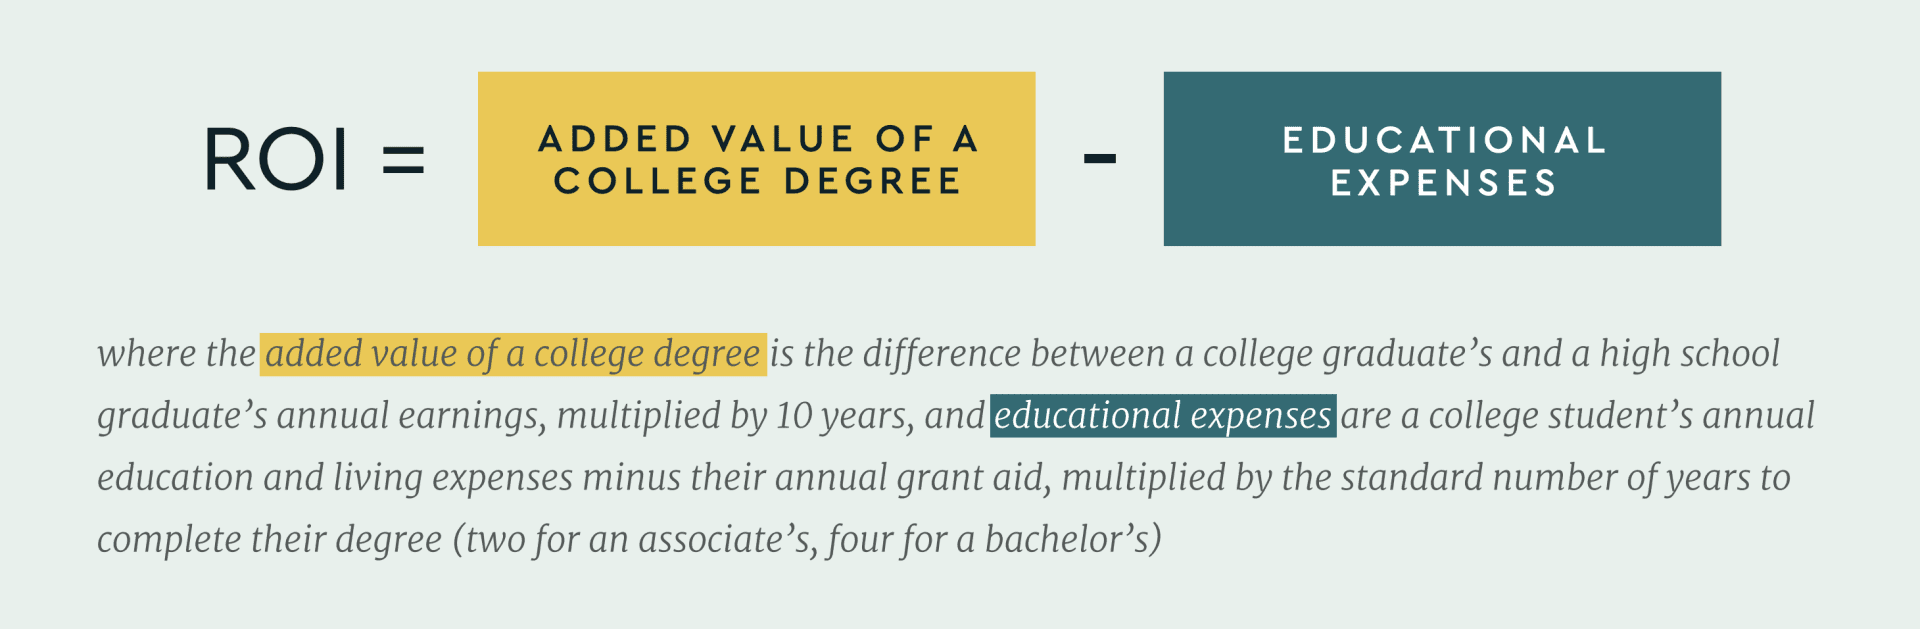
ROI represents the economic premium of a college degree minus its costs. It looks at how much more a graduate earns over 10 years compared with a typical high school graduate, among those employed full time, then subtracts the average net cost to complete a degree at a public institution.
The ROI calculation can be expressed in the formula depicted below. A college graduate has a positive ROI if they earn enough above a typical high school graduate over this 10-year period to exceed the cost of attending college. In simplified terms, if a degree costs $80,000, a college graduate would need to earn at least $80,000 over a decade above the median earnings of high school graduates to recoup their investment.4
The specifications used in this brief set a higher bar for success than other estimates of the value of college. For example, the 2023 federal Financial Value Transparency and Gainful Employment regulations compare college graduates’ earnings to the median earnings of all high school graduates in the labor force, including part-time workers and the unemployed.5 The ROI metric in this brief, on the other hand, only includes those high school graduates working full time, who earn considerably more. Additionally, limiting the time period to 10 years does not account for differences in earnings in later years, a period in which the earnings premium of a college degree tends to increase.6
A Bachelor’s Degree Pays Off for Most Graduates of Public Colleges
Over three-quarters (78%) of California public university graduates realize a positive ROI within 10 years (figure 1). This finding is consistent with research touting the bachelor’s degree as a sound investment, with a higher internal rate of return than stocks, bonds, gold, and Treasury bills.7 To be sure, higher education confers many nonmonetary benefits, and some students pursue typically low-paying careers like teaching or social work, but for most, attending college is at least in part a financial proposition.8
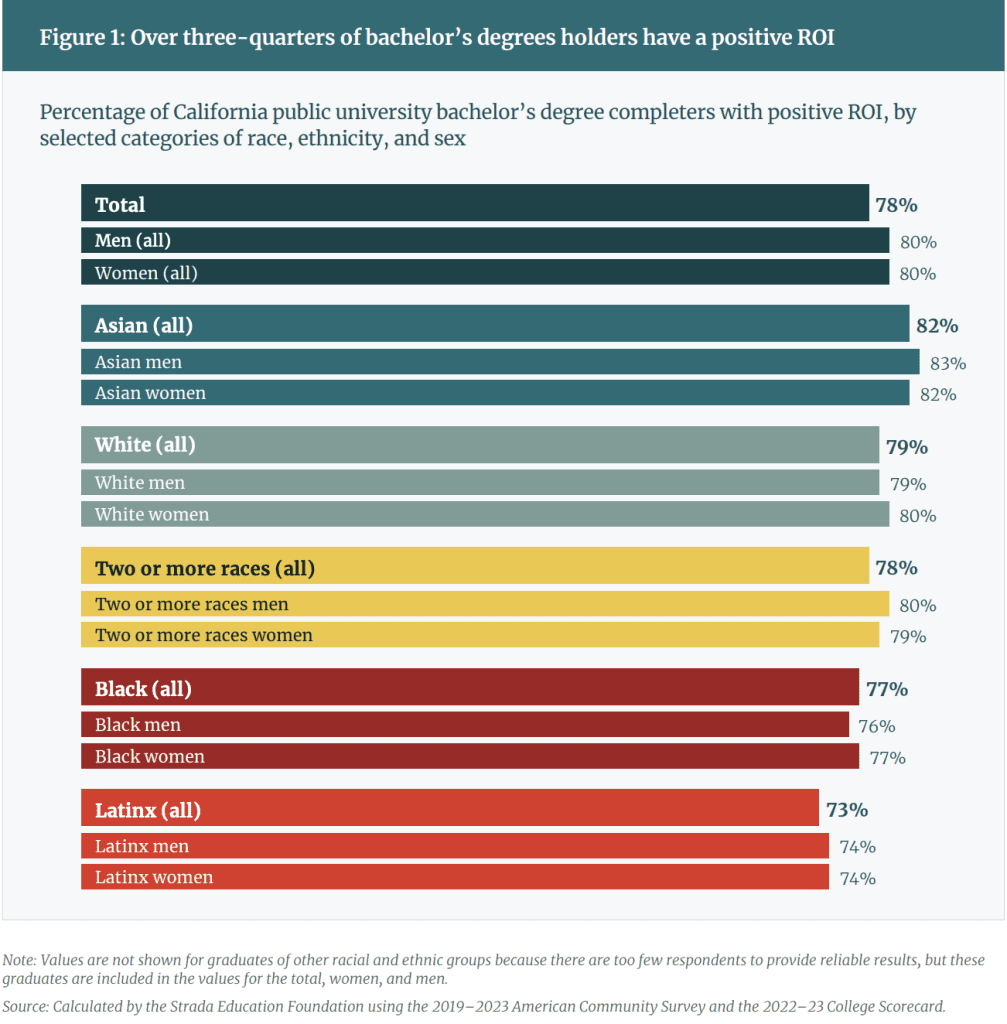
ROI dividends vary modestly by race, ethnicity, and sex. While the majority of graduates achieve a positive return on their bachelor’s degrees, the data reveals modest disparities by race or ethnicity and sex—each within five percentage points of the state average. At the high end, 83 percent of Asian men and 82 percent of Asian women enjoy a positive ROI. At the opposite end, 74 percent of both Latinx women and Latinx men realize a positive ROI.9
Women and men have about the same chance of positive ROI. Overall, women and men experience a positive ROI at the same rate (80%). (Though counterintuitive, both percentages are higher than the overall percentage because they all use different comparison groups. For details, see Appendix.) It is also the case that within every racial and ethnic group of bachelor’s degree completers, women have about the same likelihood of having a positive ROI as men.
Associate’s Degrees from Community Colleges Also Pay Off, Though Less Consistently than Bachelor’s Degrees
In California, 62 percent of associate’s degree completers earn enough to see a positive ROI within 10 years (figure 2). Moreover, the pattern of disparities in positive ROI attainment by race or ethnicity and sex reveals larger and more complex differences among associate’s degree completers than among bachelor’s degree completers.
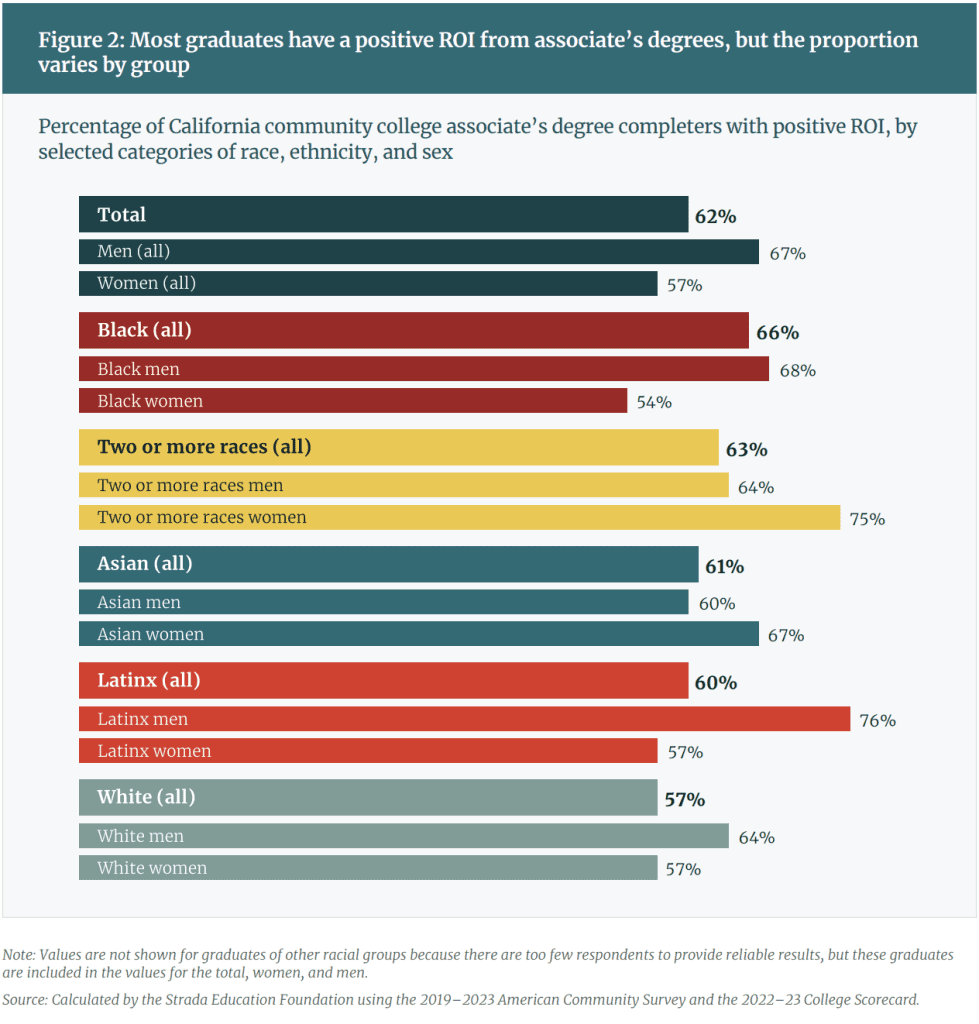
Payoffs reveal a variable pattern of differences by race and ethnicity. Among associate’s degree holders of both sexes, Black Californians have the highest rates of positive ROI (66%), followed by those of two or more races (63%), Asian Californians (61%), and Latinx Californians (60%).
Among women, Asian graduates and those of two or more races have the highest rates of positive ROI (67% and 75%, respectively), while Black women (54%) and Latinx women (57%) have the lowest rates. Among men, the order flips: Black and Latinx men with associate’s degrees have the highest rate of positive ROI (68% and 76%, respectively), followed by men of two or more races and white men (both 64%) and Asian men (60%).
Despite the evidence, skepticism about the value of college persists, with over seven in ten California parents worrying about paying for their child’s college education.10 While many students and their families struggle to pay for higher education, and even those who graduate may fail to realize a positive ROI, popular portrayals tend to exaggerate the downsides of attending college. Here are a few ways in which concerns in public discourse do not reflect most California students’ experiences:
Few students pay eye-popping sticker prices. The widely reported $100,000-plus annual cost, which includes housing, food, and other living expenses in addition to tuition and fees, applies to a small number of private colleges.11 Most California undergraduates (86%) attend lower-cost public institutions, and many receive substantial financial aid.12 California’s community colleges charge lower tuition and fees than any other state, and average costs at its public universities are in the bottom third of states.13
Debt horror stories are rare in practice. While headlines often highlight extreme student debt cases, the average borrower’s experience—particularly at public institutions—is far less dire.14 In California, the median borrower owes $15,500 in federal student loan debt—the predominant form of student borrowing—for a bachelor’s degree and $9,500 for an associate’s degree.15 Just nine percent of undergraduates enrolled in public institutions took out federal student loans in the 2022–23 academic year, the lowest of any state.16
Stories of unemployed and underemployed college graduates are misleading. Cherry-picked anecdotes about recent graduates searching fruitlessly for jobs and holding low-paying service sector positions do not accurately reflect the general reality.17 While recent college graduates report struggling to find a good job, they seem to be better off than their peers without degrees. For example, young workers with bachelor’s degrees consistently have lower unemployment rates than their peers without bachelor’s degrees—most recently, one-third lower (4.8% vs. 7.4%).18 And within five years of graduation, only a minority of workers with bachelor’s degrees are underemployed.19 That said, economic data from the past few years may portend a more challenging job market for new graduates in coming years.20
Uneven Opportunity in Education and the Workplace Help Explain Variation in ROI
While this analysis cannot capture every factor behind ROI disparities, prior research indicates two major drivers: uneven opportunities throughout students’ educational journeys and persistent discrimination in the labor market. As detailed below, white Californians, and to some extent Asian Californians, disproportionately benefit from decades of government and institutional policies that lead to advantages in higher education and employment. These advantages include greater access to more selective colleges, more lucrative majors, and betterpaying jobs.
Admissions policies favor the well-off, who are disproportionately white and Asian, and enable them to attend colleges with higher rates of payoff. Graduates of more selective colleges, public and private alike, earn more on average than their peers at less selective colleges.21 More selective colleges have greater resources and spend more on instruction, academic support, and student services than less selective colleges, which may partly explain why their graduates land higher-paying jobs.22 A variety of college admissions policies and practices favor applicants from wealthier families, including the use of standardized test scores and admissions preferences for athletes, children of alumni and major donors, and those connected to influential college insiders.23 These factors are declining in importance at California’s public universities, however.24 Meanwhile, low-income students increasingly attend community colleges and for-profit institutions, whose graduates earn less on average.25 Even within the same public university system, Black and Latinx Californians tend to attend campuses with fewer resources than their white and Asian counterparts.26 Additionally, as more selective colleges award more institution-funded merit grants and scholarships, they enroll fewer Black and low-income students even though such aid has little connection to academic achievement.27
Racially discriminatory policies help white and Asian families build wealth, facilitating access to colleges with higher rates of return. At the most fundamental level, policies restricting Californians’ ability to build and pass on wealth create and perpetuate inequities in one of the largest factors predicting attendance at more selective colleges: net worth.28 A prime example is exclusionary residential zoning and mortgage underwriting rules explicitly designed to prevent Black Americans from owning homes, which is the primary means by which most Americans build and hold wealth.29 Today, the median white household’s net worth ($250,000) is more than nine times that of the median Black household ($27,000) and more than five times that of the median Latinx household ($49,000).30 Asian Americans, a heterogeneous group with origins in over 20 countries and wide-ranging immigration patterns, have educational outcomes that vary even across broad categories like South Asian and Southeast Asian.31 Like Black Americans, they have experienced housing and other forms of discrimination in California and elsewhere. However, for reasons too complex to detail in this brief, Asian Americans overall are now in a much better economic position.32 The median Asian American household’s net worth ($321,000) exceeds that of white American households.33 Family wealth enables children and teens to take more rigorous classes at better-financed schools, participate in costly extracurricular activities and club sports, and pay for private test preparation and counseling services that are not available to families of lesser means.34 And, of course, families can and do use both wealth and income generated from assets (rents, dividends, interest, and so forth) to defray the cost of attending college. The end result is that students from wealthier families, who are disproportionately white and Asian, are better able to afford more selective colleges.
Students have uneven access to high-earning majors. Even after admission, fewer Black and Latinx college students major in fields linked to higher earnings, such as business, engineering, and nursing, compared with Asian and white students. This difference is due in part to Black and Latinx students’ more limited access to advanced high school classes, which serve as pathways to many high-earning majors.35 Historically and to this day, both California State University (CSU) and University of California (UC) campuses restrict entry to popular majors, many of which lead to high-paying jobs.36
Employment discrimination impacts returns of education. A degree does not guarantee equal opportunity in the workforce, as studies repeatedly show discrimination against Black and Latinx workers. For example, job applicants with characteristically Black and Latinx names receive far fewer callbacks than otherwise identical applicants without such racial or ethnic identifiers.37 One review of the research finds that “race has large effects on employment opportunities, with a Black job seeker anywhere between 50 and 500 percent less likely to be considered by employers as an equally qualified white job applicant.”38 Once hired, white employees outearn Black employees, even controlling for sex, age, education, occupation, and location.39
Recommendations for Advancing ROI for All Graduates
Though most college graduates realize a positive ROI, a sizable minority does not, representing hundreds of thousands of Californians with unrealized potential. To ensure that more Californians see a meaningful return on their college investment, state leaders and institutions can act on the following fronts. These recommendations are particularly important for first-generation college students, who are disproportionately Black and Latinx and who have less access to the networks and supports at home that can equip them for college and career success.
Promote Policies to Help Students Pay for College
Even within existing programs, colleges and state policymakers can improve the reach and efficacy of student financial aid. Over 20 percent of eligible California Community Colleges (CCC) students, for example, do not receive a Pell Grant.40 Offering better support, including more hands-on assistance, is an evidence-based and cost-effective approach to increase financial aid applications, one that is endorsed by the state’s Master Plan for Career Education.41 State and local agencies should bolster initiatives to help eligible needy students access safety net programs—such as CalFresh food assistance, Medi-Cal health insurance, state and federal earned income tax credits, and workforce programs. These efforts could include streamlining application and renewal processes, expanding outreach, and eliminating unnecessary administrative barriers.42
Expand Career-Building Learning Opportunities that Boost Students’ Earning Potential
Colleges should work with employers to develop and promote activities that enhance career readiness and position students for a seamless transition to employment. For instance, they should work with employers to encourage participation in internships and other work-based learning opportunities associated with better early career outcomes.43 Internships should be compensated, not only to make them accessible to students of lesser means but also because paid interns enjoy higher postcollege earnings, more job offers, and lower unemployment than their classmates who completed unpaid or no internships.44 Colleges can also help develop durable skills like public speaking, collaboration, and leadership that are in high demand by employers.45 These skills can be cultivated in the classroom, through work-based learning, and in other venues such as workshops and trainings, perhaps culminating in badges and other microcredentials.
Maximize the Use of Employment Data to Inform Students’ Choices and to Refine and Improve Programs and Policies
Students often hold inaccurate beliefs about typical postcollege earnings, increasing the odds of making educational choices inconsistent with their goals and lowering the odds of realizing a positive ROI.46 Colleges should actively and strategically use data to share typical earnings by program with incoming students and their advisors, identifying low-performing programs for special attention, aligning offerings to match employment demand, and promoting policies and activities associated with positive outcomes.47 Colleges should ensure that earnings information reaches students early to help them select majors that lead to jobs that allow them to at least recoup the cost of their educations and avoid dead ends. Some students will opt for lower-paying careers with high social value and other benefits, even if it leads to a negative ROI, but they should do so intentionally and not out of ignorance.48 Unfortunately, many students receive career-related information too late or not at all. A survey of over 5,000 college students and recent graduates in California, for example, found that only half received information on potential earnings in careers related to their respective programs by the end of their first year, and more than a third never learned this information at all or only after leaving college.49 Moreover, colleges should engage employers to identify emerging trends and details not available from labor market data and to shape academic programs and pathways that lead directly into careers.
Scale Up Evidence-Based Programs to Improve Completion and Transfer
Californians with bachelor’s degrees earn more on average than those with associate’s degrees, who in turn earn more than those who left college without a degree.50 And when it comes to degree completion and transfer, time is money: students who take longer forgo income, incur additional expenses, and risk exhausting their eligibility for some types of financial aid. Policymakers and colleges should promote research-backed methods to enable timely degree completion, including through transfer from community colleges to four-year institutions.51 Of the roughly six in ten CCC students who intend to earn a bachelor’s degree, only 10 percent transfer within two years, and 19 percent do so within four years.52 Leaving college with just an associate’s degree reduces one’s chance of a positive ROI from 78 percent to 62 percent, despite the typically lower cost of earning an associate’s degree, not to mention the even less promising prospects for those who leave with no degree at all. CCC, CSU, and UC should work together to adopt and disseminate successful practices, increase the number of CSU majors with an Associate Degree for Transfer pathway, maximize the number of credits that transfer, and expand the transfer pathway to the UC system.
Continue the Thoughtful Development of a Smart Data System
C2C Data System promises to help individuals and those who advise them (high school and college counselors, faculty, family members) make better-informed choices about educational and career decisions that influence their future earnings. Adding critical but missing employment data will help make this resource even more valuable for decision-making. One proposal would collect occupations, hours worked, and employer locations for California workers.53 Another enhancement would use tax records to measure earnings for the estimated 14 percent of working-age Californians who are missing from the earnings data currently leveraged by the C2C (those with self-employment income from gig work and other independent contracting).54 Tax records would also capture income from federal and military employees who do not participate in the state unemployment insurance system.55 In addition, C2C staff and data providers should continue to seek earnings data for California graduates employed out-of-state, subject to privacy protections, as the omission of these data may distort the true returns of higher education.56
College: A Good Investment That Can Be Made Even Better
All Californians deserve an economic payoff from a college degree, and most do get one. Yet there is still work to be done to increase this proportion and to eliminate inequities in ROI. Differences in ROI by race and ethnicity point to inequities in wealth-building and educational opportunities that limit the ability of Black and Latinx students to attend selective colleges, receive adequate financial aid, and select majors that lead to high-paying jobs. These disparities also reflect persistent employment discrimination against Black and Latinx workers. Colleges and policymakers have many avenues to lower the costs of college, increase the odds that graduates land well-paying jobs, and expand the strategic use of data to ignite and track progress on both fronts. With concerted and sustained effort, California’s colleges and leaders can raise the odds that all graduates will see a positive return on their investments.
Several complicating factors make these results far from a straightforward comparison of the costs and benefits of graduating from college. First, the educational costs imputed to college graduates are not exact reflections of the actual trade-offs that students face. The net price of attendance exaggerates costs by including living expenses (housing, food, transportation) that graduates would have paid even if they had not attended college. At the same time, it leaves out the opportunity costs students incur by attending classes instead of working for pay. The estimated living expenses rarely account for the additional costs of caring for dependents, though legislation enacted in 2024 requires CCC and CSU, and requests UC, to proactively adjust the cost of attendance for student parents.57 And most students take longer than the standard four years to complete a bachelor’s degree or two years to complete an associate’s degree, though their expenses will also be reduced if they do not enroll continuously or full time.58
Turning to the other component of the ROI equation, many factors affect earnings, chief among them being the field of study.59 Options for choosing a field of study, in turn, are shaped by each college’s resources and policies.60 This analysis does not account for earnings variation by major or the constraints students may face in entering programs leading to high-paying jobs. These and other measurement challenges prompt further refinement to these results in the coming years, especially as data from C2C become available to researchers.
Acknowledgments
We thank College Futures for partnering with us on this research series. We also gratefully acknowledge the support of the Gates Foundation; the Evelyn and Walter Haas, Jr. Fund; the Kresge Foundation; and the Molina Family Foundation. We very much appreciate the suggestions of Diego Arambula, Lauren Asher, Michael Itzkowitz, Lenny Mendonça, and Eloy Ortiz Oakley. We thank Nichole Torpey-Saboe of the Strada Education Foundation, who conducted the ROI calculations and provided helpful feedback on this research. And we thank PrettyMe Creative Solutions, LLC, who designed this publication, and Dragonfly Editorial, which provided copyediting. Photos were sourced from the Complete College Photo Library. Any errors are the responsibility of California Competes.
Appendix
How Can Female and Male Graduates Both Have Higher Positive ROI Percentages than All Graduates Combined?
How can 80 percent of women and 80 percent of men with bachelor’s degrees achieve positive ROI when the overall total is 78 percent? The reason is that each group’s ROI is calculated against its own comparison group of high school graduates. When we combine women and men together, the comparison group also combines, changing the median and the results.
Imagine earnings for six high school graduates and six college graduates, split evenly between women and men, as shown in tables 1-3. For simplicity, these values ignore educational costs, but the logic is the same.
- Women: All three women with bachelor’s degrees (100%) earn more than the median earnings of women with a high school diploma (table 1).
- Men: All three men with bachelor’s degrees (100%) earn more than the median earnings of men with a high school diploma (table 2).
- Total: When women and men are combined, the overall median high school earnings rise above the women’s median. One woman graduate now falls below it, so only five out of six (83%) earn more than the median earnings of a high school graduate (table 3).


Notes
- Strada Education Foundation. (2024). Appendix: Return on investment.
- Abel, J. R., & Deitz, R. (2025). Is college still worth it? Liberty Street Economics, Federal Reserve Bank of New York; Cooperative Institutional Research Program (2025). 2024 CIRP Freshman Survey data tables, p. 15. Higher Education Research Institute, University of California, Los Angeles; Ma, J., & Pender, M. (2023). Education pays 2023: The benefits of higher education for individuals and society. College Board.
- Earnings and demographic data are obtained from the 2019–2023 American Community Survey (Ruggles, S., Flood, S., Sobek, M., Backman, D., Cooper, G., Rivera Drew, J. A., Richards, S., Rogers, R., Schroeder, J., & Williams, K. C. W.[2025]. IPUMS USA: Version 16.0 [dataset]). Net prices of attendance are calculated from the 2022–23 College Scorecard for federal aid recipients and exclude especially high and low values. The analysis does not track actual individuals from college into the workplace, but it offers a rough approximation of their earnings premiums, expenses, and returns.
- The actual calculations adjust earnings for annual growth and inflation, exclude individuals working less than 35 hours a week or fewer than 40 weeks in the prior year, exclude individuals with zero earnings, and exclude institutions with especially high and low net prices. For a detailed explanation of the metrics and assumptions used to calculate ROI, see Strada Education Foundation. (2024). Appendix.
- Student assistance general provisions, 34 C.F.R. 668.2 (2023).
- Deming, D. J. (2023). Why do wages grow faster for educated workers? (working paper w31373). National Bureau of Economic Research.
- Barrow, L., & Malamud, O. (2015). Is college a worthwhile investment? Annual Review of Economics, 7(1), 519-555; Greenstone, M., & Looney, A. (2011). Where is the best place to invest $102,000—in stocks, bonds, or a college degree? Brookings Institution; Levine, P., & Pardue, L. (2024). Yes, college is worth it. Brookings Institution.
- Baum, S., & Espinosa, L. (2021). Exploring the importance of low wage, high social value careers. Postsecondary Value Commission; Ma & Pender. (2023). Education pays 2023; Oreopoulos, P., & Salvanes, K. G. (2011). Priceless: The nonpecuniary benefits of schooling. Journal of Economic Perspectives, 25(1), 159–184.
- There are too few members of other racial and ethnic groups to provide reliable results within California. For national-level estimates for American Indian and Alaska Native graduates and more detailed categories based on national origin (e.g., Chinese, Mexican, Cuban), see Strada Education Foundation. (2024). Appendix, pp. 11–13.
- Qinq, L. (2024). College affordability, p. 6. Legislative Analyst’s Office; Zhou, R. Y. (2024). College affordability in California. Public Policy Institute of California.
- Lieber, R. (2024, April 5). Some colleges will soon charge $100,000 a year. How did this happen? The New York Times; Sumida, N. (2024, October 1). These elite California colleges could soon hit a sticker price of $100K. Here’s how they compare. San Francisco Chronicle.
- Cameron, M., Johnson, R., Lacy, T. A., Wu, J., Siegel, P., Holley, J., & Wine, J. (2023). 2019–20 National Postsecondary Student Aid Study (NPSAS:20): First look at student financial aid estimates for 2019–20 (NCES 2023-466), tables A-1, A-2. National Center for Education Statistics, US Department of Education; National Center for Education Statistics. (n.d.). Student enrollment: How many students enroll in postsecondary institutions annually? Integrated Postsecondary Education Data System.
- National Center for Education Statistics. (n.d.). Average undergraduate tuition, fees, room, and board charges for full-time students in degree-granting postsecondary institutions, by control and level of institution and state: Academic years 2021-22 and 2022-23. Digest of education statistics 2023, table 330.20.
- Leonhardt, D. (2014, June 24). The reality of student debt is different from the clichés. The New York Times; McDonald, M., & Brady, P. (2014). The plural of anecdote is data (except for student debt). Hamilton Place Strategies.
- California Competes. (n.d.). What do people owe in student loans? Postsecondary to Prosperity Dashboard; Loan package by source of loan (LOANSRC). (2025, September 15). In National Postsecondary Student Aid Study: 2020 undergraduate students codebook.
- National Center for Education Statistics. (n.d.). Financial aid: What is the percent of undergraduate students awarded federal student loans? Integrated Postsecondary Education Data System.
- Carey, K. (2023, December). The myth of the unemployed college grad. The Atlantic.
- Values are from June 2025. Federal Reserve Bank of New York. (2025, August 1). The labor market for recent college graduates: Unemployment rates for recent college graduates versus other groups.
- Burning Glass Institute and Strada Institute for the Future of Work. (2024). Talent disrupted: Underemployment, college graduates, and the way forward, p. 10; Federal Reserve Bank of New York. (2025, August 1). The labor market for recent college graduates: Underemployment rates for recent college graduates.
- Cuellar Mejia, M., & Johnson, H. (2025, April 17). Room for progress in college graduates’ transition to the labor market. Public Policy Institute of California; Thompson, D. (2025, April 30). Something alarming is happening to the job market. The Atlantic.
- Chetty, R., Friedman, J. N., Saez, E., Turner, N., & Yagan, D. (2020). Income segregation and intergenerational mobility across colleges in the United States. The Quarterly Journal of Economics, 1567–1633; Witteveen, D., & Attewell, P. (2017). The earnings payoff from attending a selective college. Social Science Research, 66, 154–169.
- Lovenheim, M., & Smith, J. (2023). Returns to different postsecondary investments: Institution type, academic programs, and credentials. In E. A. Hanushek, S. Machin, & L. Woessmann (Eds.), Handbook of the Economics of Education (Vol. 6, pp. 187–318). Elsevier.
- Asimov, N. (2020, September 24). Dianne Feinstein’s husband named in UC admissions scandal, says he wrote recommendation letters for connected applicants ‘a bunch of times’. San Francisco Chronicle; Hextrum, K. (2021). Special admission: How college sports recruitment favors white suburban athletes. Rutgers University Press; Massey, D. S., & Mooney, M. (2007). The effects of America’s three affirmative action programs on academic performance. Social Problems, 54(1), 99–117; Zada, G. (2025, August 13). California banned legacy admissions at private schools. Stanford is sticking with it. KQED.
- Burke, M. (2021, November 8). University of California sticks with test-free admissions, won’t replace SAT and ACT with new standardized test. EdSource; Smith, A. A. (2022, March 22). Cal State board officially eliminates SAT/ACT for admissions. EdSource.
- Hamilton, L. T., Dawson, C., Armstrong, E. A., & Waller-Bey, A. (2024). Racialized horizontal stratification in US higher education: Politics, process, and consequences. Annual Review of Sociology, 50, 75–99; Hoover, E. (2025, May 19). Why the college premium is shrinking for low-income students. The Chronicle of Higher Education.
- Hamilton, L. T., & Nielsen, K. (2021). Broke: The racial consequences of underfunding public universities. University of Chicago Press.
- Carey, K. (2022, July 25). The single most important thing to know about financial aid: It’s a sham. Slate; Ehrenberg, R. G., Zhang, L., & Levin, J. M. (2006). Crafting a class: The trade-off between merit scholarships and enrolling lower-income students. The Review of Higher Education, 29(2), 195-211; Griffith, A. L. (2011). Keeping up with the Joneses: Institutional changes following the adoption of a merit aid policy. Economics of Education Review, 30(5), 1022-1033.
- Jez, S. J. (2014). The differential impact of wealth versus income in the college-going process. Research in Higher Education, 55(7), 710-734.
- “With less inherited wealth, African Americans today are generally less able than their white peers to attend good colleges.” Rothstein, R. (2017). The color of law: A forgotten history of how our government segregated America, p. xi. Liveright Publishing.
- Kochhar, R., & Moslimani, M. (2023). Wealth surged in the pandemic, but debt endures for poorer Black and Hispanic families. Pew Research Center.
- Byon, A. (2020). Everyone deserves to be seen: Recommendations for improved federal data on Asian Americans and Pacific Islanders. Institute for Higher Education Policy and Southeast Asia Resource Action Center; California Competes. (2021, June 11). Challenges and solutions to comparing outcomes by race and ethnicity.
- Hilger, N. (2017). Upward mobility and discrimination: The case of Asian Americans (working paper w22748). National Bureau of Economic Research.
- Kochhar & Moslimani. (2023). Wealth surged in the pandemic.
- Carnevale, A. P., Schmidt, P., & Strohl, J. (2020). The merit myth. The New Press; Mandery, E. (2022). Poison ivy: How elite colleges divide us. The New Press; Tough, P. (2019). The years that matter most: How college makes or breaks us. Houghton Mifflin Harcourt.
- Bleemer, Z., Davidson, A., & Mehta, A. (2023). Restricted access to lucrative college majors harms underrepresented students most. Brookings Institution; Patrick, K., Socol, A., & Morgan, I. (2020). Inequities in advanced coursework: What’s driving them and what leaders can do. EdTrust.
- Asimov, N. (2025, March 22). UC’s most competitive major has a 1% acceptance rate, and it’s not computer science. San Francisco Chronicle; Drummer, D. (2025). The declining impact of impaction at the California State University. Campaign for College Opportunity.
- Kline, P., Rose, E. K., & Walters, C. R. (2022). Systemic discrimination among large US employers. The Quarterly Journal of Economics, 137(4), 1963–2036; Neumark, D. (2018). Experimental research on labor market discrimination. Journal of Economic Literature, 56(3), 799–866.
- Pager, D. (2007). The use of field experiments for studies of employment discrimination: Contributions, critiques, and directions for the future. The Annals of the American Academy of Political and Social Science, 609(1), 104–133.
- Daly, M. C., Hobijn, B., & Pedtke, J. H. (2017). Disappointing facts about the Black-white wage gap. FRBSF Economic Letter, 26, 1–5.
- Martorell, P., & Friedmann, E. (2018). Money left on the table (Vol. 3, No. 3). UC Davis Wheelhouse: The Center for Community College Leadership and Research.
- The cost per participant in 2008 was $88. Bettinger, E. P., Long, B. T., Oreopoulos, P., & Sanbonmatsu, L. (2012). The role of application assistance and information in college decisions: Results from the H&R Block FAFSA experiment. The Quarterly Journal of Economics, 127(3), 1205–1242; Governor’s Council for Career Education. (2025). California’s master plan for career education, p. 42.
- California Competes. (forthcoming, 2025). From financial aid to full support: Increasing student success through benefit access.
- California Competes. (forthcoming, 2025). From college to career: California learners’ experiences with work-based learning; Deming, D., Fuller, J., Lipson, R., McKittrick, K., Epstein, A., & Catalfamo, E. (2023). Delivering on the degree: The college-to-jobs playbook. Harvard Kennedy School.
- Nietzel, M. T. (2024). The underemployed college graduate and how not to become one. Washington Monthly; Torpey-Saboe, N., Leigh, E. W., & Clayton, D. (2022). The power of work-based learning, p. 4. Strada Education Foundation.
- America Succeeds and EMSI Burning Glass. (2021). The high demand for durable skills.
- Baker, R., Bettinger, E., Jacob, B., & Marinescu, I. (2018). The effect of labor market information on community college students’ major choice. Economics of Education Review, 65, 18–30; Conlon, J. J. (2021). Major malfunction: A field experiment correcting undergraduates’ beliefs about salaries. Journal of Human Resources, 56(3), 922–939.
- Leading data sources for graduates’ earnings include the US Department of Education’s College Scorecard, which is used in this brief, and student-matched earnings data reported in system-level dashboards by CCC, CSU, and UC. Most colleges conduct first-destination surveys of their graduates’ immediate employment and further education plans (Gray, K. [2022]. More than 80% of career centers conduct first-destination surveys. National Association of Colleges and Employers). These sources will soon be joined by earnings data in California’s Cradle-to-Career Data System. Additionally, colleges can use labor market forecasts like the US Department of Labor’s Occupational Outlook Handbook and real-time measures of employer demand, such as analyses by the CCC Centers of Excellence for Labor Market Research.
- Armstrong, E. A., & Hamilton, L. T. (2013). Paying for the party: How college maintains inequality, ch. 7. Harvard University Press.
- California Competes. (forthcoming, 2025). From college to career: California learners’ experiences with career pathways guidance.
- Cuellar Mejia, M., Perez, C. A., Hsieh, V., & Johnson, H. (2025). Iscollege worth it? Public Policy Institute of California.
- Cuellar Mejia, M., Johnson, H., Perez, C. A., & Jackson, J. (2023). Strengthening California’s transfer pathway, pp. 4, 19–20. Public Policy Institute of California; Meyer, K., Page, L., Reber, S., & Nurshatayeva, A. (2025). College access (and success) programs. In D. Harris (Ed.), Live Handbook of Education Policy Research. Association for Education Finance and Policy.
- Cuellar Mejia et al. (2023). Strengthening California’s transfer pathway.
- Employment Development Department, California Workforce Development Board, and Labor and Workforce Development Agency. (2024). SB 755 (2022): Expanding workforce performance analysis and employer quarterly wage reports: Final report to legislature; California Cradle-to-Career Data System, SB 575. (2025).
- Bernhardt, A., Campos, C., Prohofsky, A., Ramesh, A., & Rothstein, J. (2022). Independent contracting, self-employment, and gig work: Evidence from California tax data.ILR Review, 76(2), 357–386.
- Radwin, D., & Horn, L. (2014). Measuring workforce preparation and employment outcomes. RTI Press.
- Foote, A., & Stange, K. M. (2022). Attrition from administrative data: Problems and solutions with an application to postsecondary education (working paper w30232). National Bureau of Economic Research.
- California Alliance for Student Parent Success. (2024, September 30). AB 2458 (Berman): Greater Accessibility, Information, Notice, and Support (GAINS) for Student Parents Act; California Competes. (2020). Clarifying the true cost of college for student parents.
- Green, C., & Radwin, D. (2012). Characteristics of associate’s degree attainers and time to associate’s degree (NCES 2012-271). National Center for Education Statistics, US Department of Education; National Center for Education Statistics. (n.d.). Time to degree. US Department of Education.
- Andrews, R. J., Imberman, S. A., Lovenheim, M. F., & Stange, K. (2024). The returns to college major choice: Average and distributional effects, career trajectories, and earnings variability. Review of Economics and Statistics, 106, 1-45; Itzkowitz, M. (2024). California college programs that pay: Measuring return on investment across majors and credentials. College Futures Foundation.
- Conzelmann, J., Owen, S., & Simon, A. (2025). College majors and programs: Choices and returns. In D. Harris (Ed.), Live Handbook of Education Policy Research. Association for Education Finance and Policy.

